Beetle — Mobile Application Static Security Platform, Explained
A walkthrough of Beetle, the open-source mobile static analysis platform I built: how to run it, what a scan actually does, what every panel in the interface is for, and how the analysis engines work underneath.
- Beetle is an offline-first static analysis platform for Android APKs and iOS IPAs, including Flutter and React Native builds.
- Upload a build; it unpacks, decompiles, runs its detection engines, and returns findings — each tied to concrete evidence, an ownership tag, a confidence score, and a standards mapping.
- It links related findings into attack chains, maps everything to OWASP MASVS, and exports to PDF, SBOM, SARIF, and a CI gate.
- It runs at
http://localhost:9005via Docker and works fully offline. An optional AI layer explains findings but never generates or alters them.
What Beetle is
Static analysis means examining an app without running it. You take the shipped artifact — an Android .apk or an iOS .ipa — and work backwards: unzip it, decode the manifest and resources, decompile the code, and reconstruct what the app was built to do. Nothing executes. It’s the first pass on any mobile assessment, building an inventory of the attack surface — entry points, permissions, network settings, third-party code — before you commit to dynamic testing, and it can inspect every class present in the shipped artifact rather than only the ones someone had time to open. It isn’t total, though: native code, dynamically loaded code, and reflection can all move behaviour out of reach of static analysis — part of what dynamic testing exists to cover.
Builds ship weekly, and manual review doesn’t scale — but automation only helps if a reviewer can act on its output without re-checking every line. So Beetle’s goal is that every finding is independently verifiable: the report says where it came from (the exact evidence), whether the code can actually be reached, whether it originates from first-party application code or a bundled dependency, and how sure the analysis is — a confidence score derived from the amount and quality of the supporting evidence rather than assigned by hand. Those four answers let a reviewer accept or dismiss a finding quickly.
One honest limit: static analysis reasons about what an app can do, not what it will do at runtime, and it can’t prove exploitability. A path through the call graph is a lead, not a working exploit — Beetle makes human confirmation fast, it doesn’t remove it.
Getting it running
Beetle ships as a Docker stack. Clone it, build the images, and bring it up:
quickstartgit clone https://github.com/f3rb123/beetle.git
cd beetle
docker compose build
docker compose up
# open http://localhost:9005 — default login beetle / beetleThe UI comes up on http://localhost:9005, and analysis runs entirely offline — nothing about a build leaves the machine. Optional integrations (AI providers — Claude, OpenAI, Gemini, DeepSeek, or a local Ollama — and a VirusTotal lookup) are enabled with environment keys in docker-compose.yml, and everything works without them.
Beetle seeds a development admin account on first boot — username beetle, password beetle. That’s fine on localhost. Before putting Beetle anywhere reachable by anyone else, override CORTEX_ADMIN_USERNAME and CORTEX_ADMIN_PASSWORD and set a CORTEX_JWT_SECRET. (The CORTEX_ prefix is a holdover from the project’s former name — the variables are Beetle’s.)
To wipe everything and start clean, run docker compose down -v — this deletes databases, uploads, reports, and volumes.
The scan workflow
You start from the workspace Home, which lists your scan targets and recent activity. Drop an .apk or .ipa onto it — Flutter and React Native builds use the same upload, since Beetle detects the framework itself — and the file is registered, hashed, and queued.
From there the scan moves through a fixed pipeline. Each stage adds metadata; none throws away what an earlier stage produced:
scan target → registry → platform analyzer → intelligence engines
     → canonical findings → ownership → confidence
     → evidence → fusion → attack chains → report
The platform analyzer unpacks and decompiles the build and inventories it; the intelligence engines run detection and emit raw candidates, which are normalised into one canonical shape — the same fields whichever engine found them, so everything downstream reads uniformly. Everything after that adds metadata — ownership, confidence, evidence, and fusion, each described below — before attack chains correlate what remains into multi-step paths.
That back half is where the noise is removed: low-confidence detections are filtered out and duplicates consolidated, turning many raw detections into a short list a person can work through. As one example of the shape — not a fixed ratio — a representative scan produced 61 raw detections that reduced to 29 high-signal findings: 24 separated out as library-owned, 3 duplicates merged. When it finishes, you land on the Overview.
The interface, panel by panel
The sidebar groups its views by task. Here’s each — the question it answers, and when you’d open it.
Overview, Findings, Attack Chains
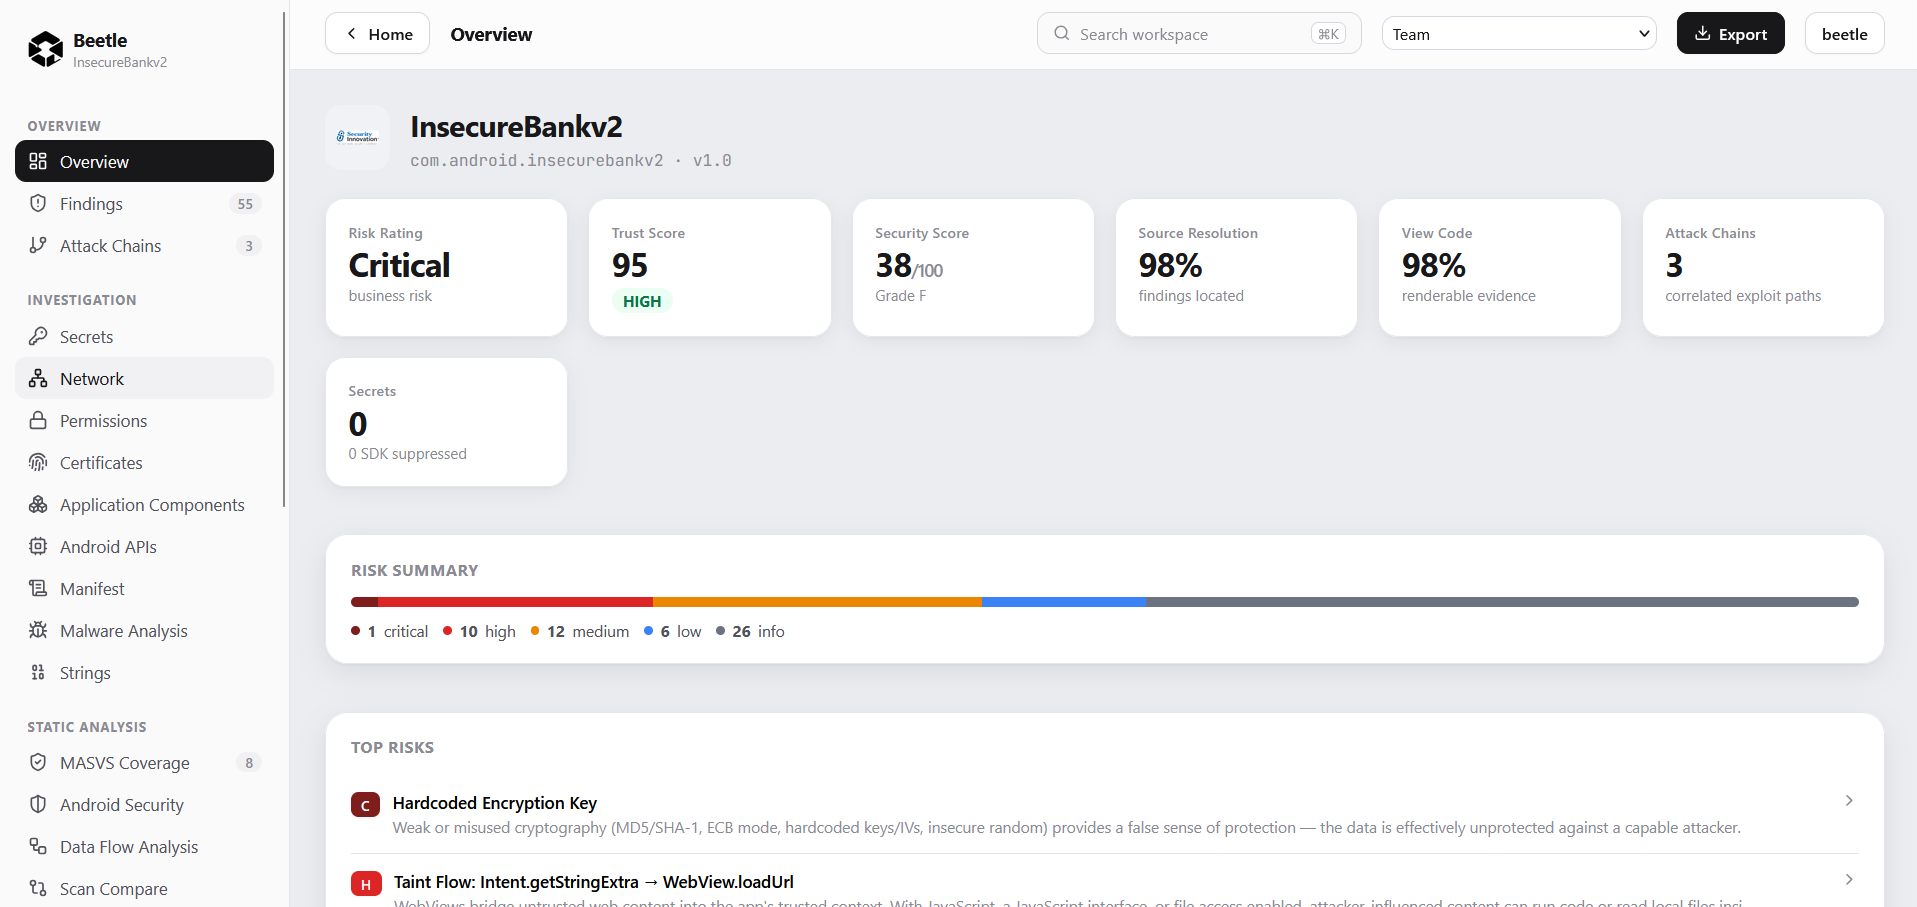
Overview is the triage screen you open first. It reduces a finished scan to a few headline numbers — a security score, a trust score, how much evidence resolved to source — a severity rollup, and the highest-risk items. The two scores differ: the security score rates the app; the trust score rates the report — how complete the evidence is and how confidently findings were classified. A high trust score means the findings are checkable, not that the app is safe.
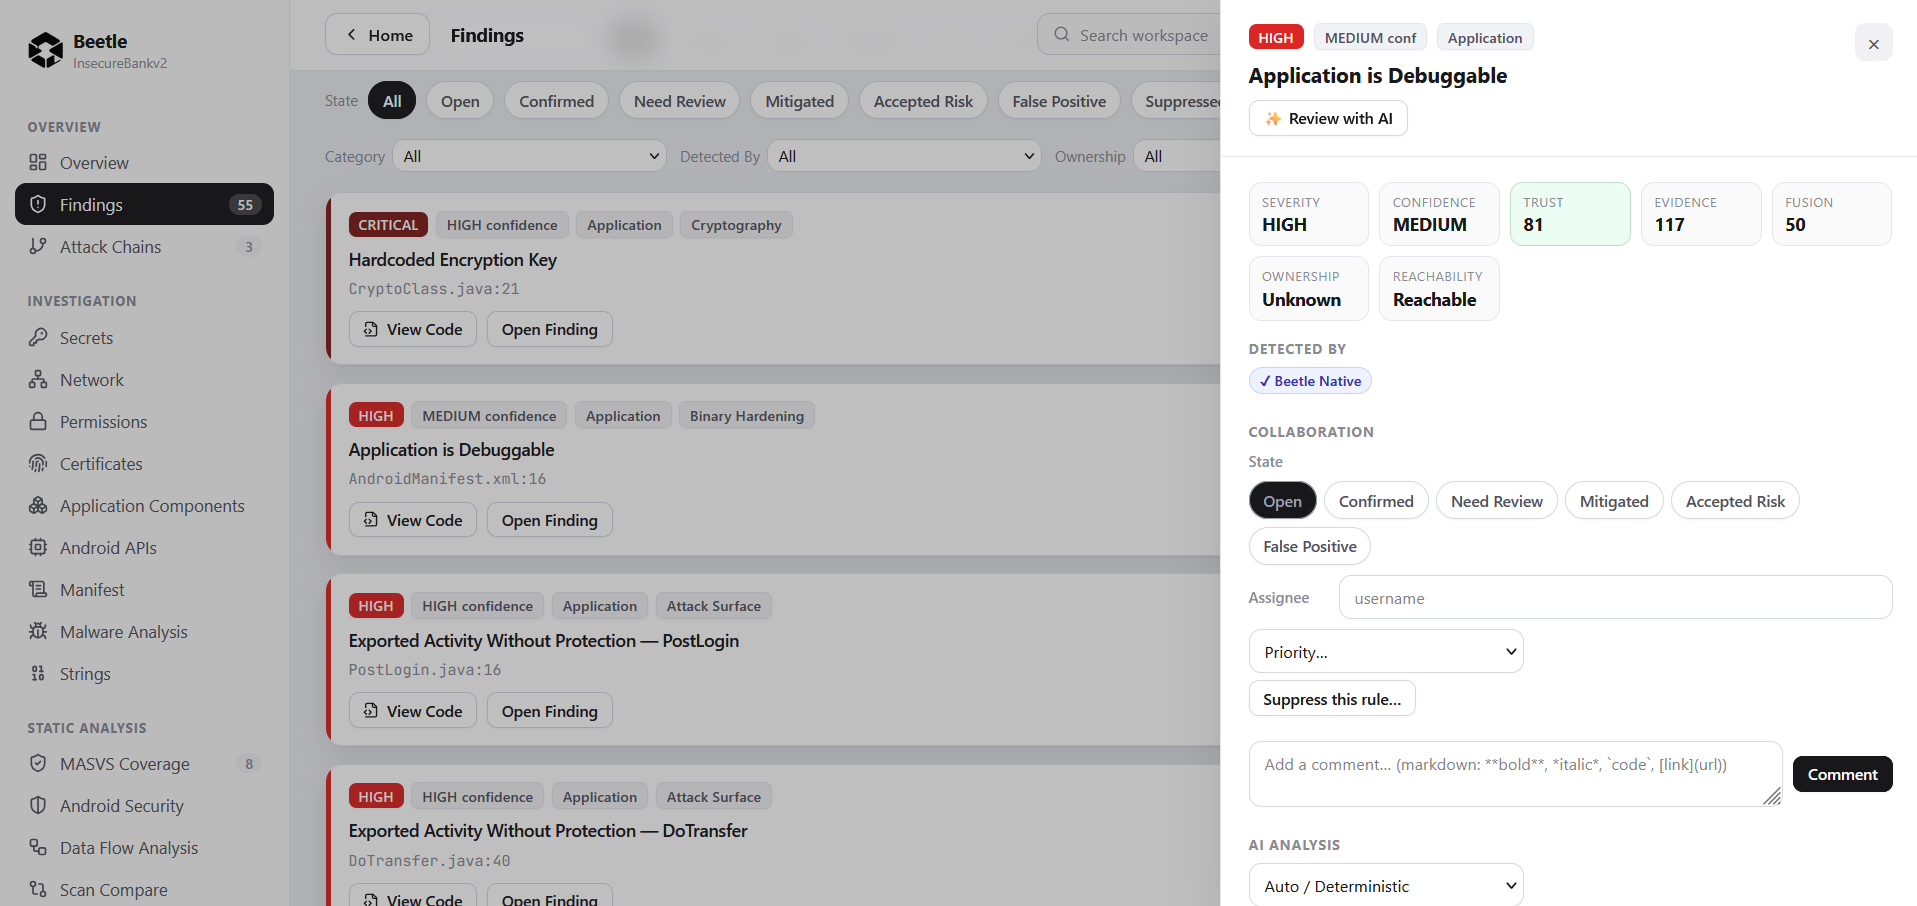
Findings is the working list: one row per finding — severity, confidence, ownership, standards category — filterable by state, category, detector, and ownership. Opening one reveals a drawer with the numbers behind it (confidence, trust, evidence and fusion counts, whether the code is reachable), the detector that produced it, and a triage workflow (confirm, mark for review, mitigate, accept, or flag as a false positive). It’s where you record those decisions, so it’s where most of a review happens.
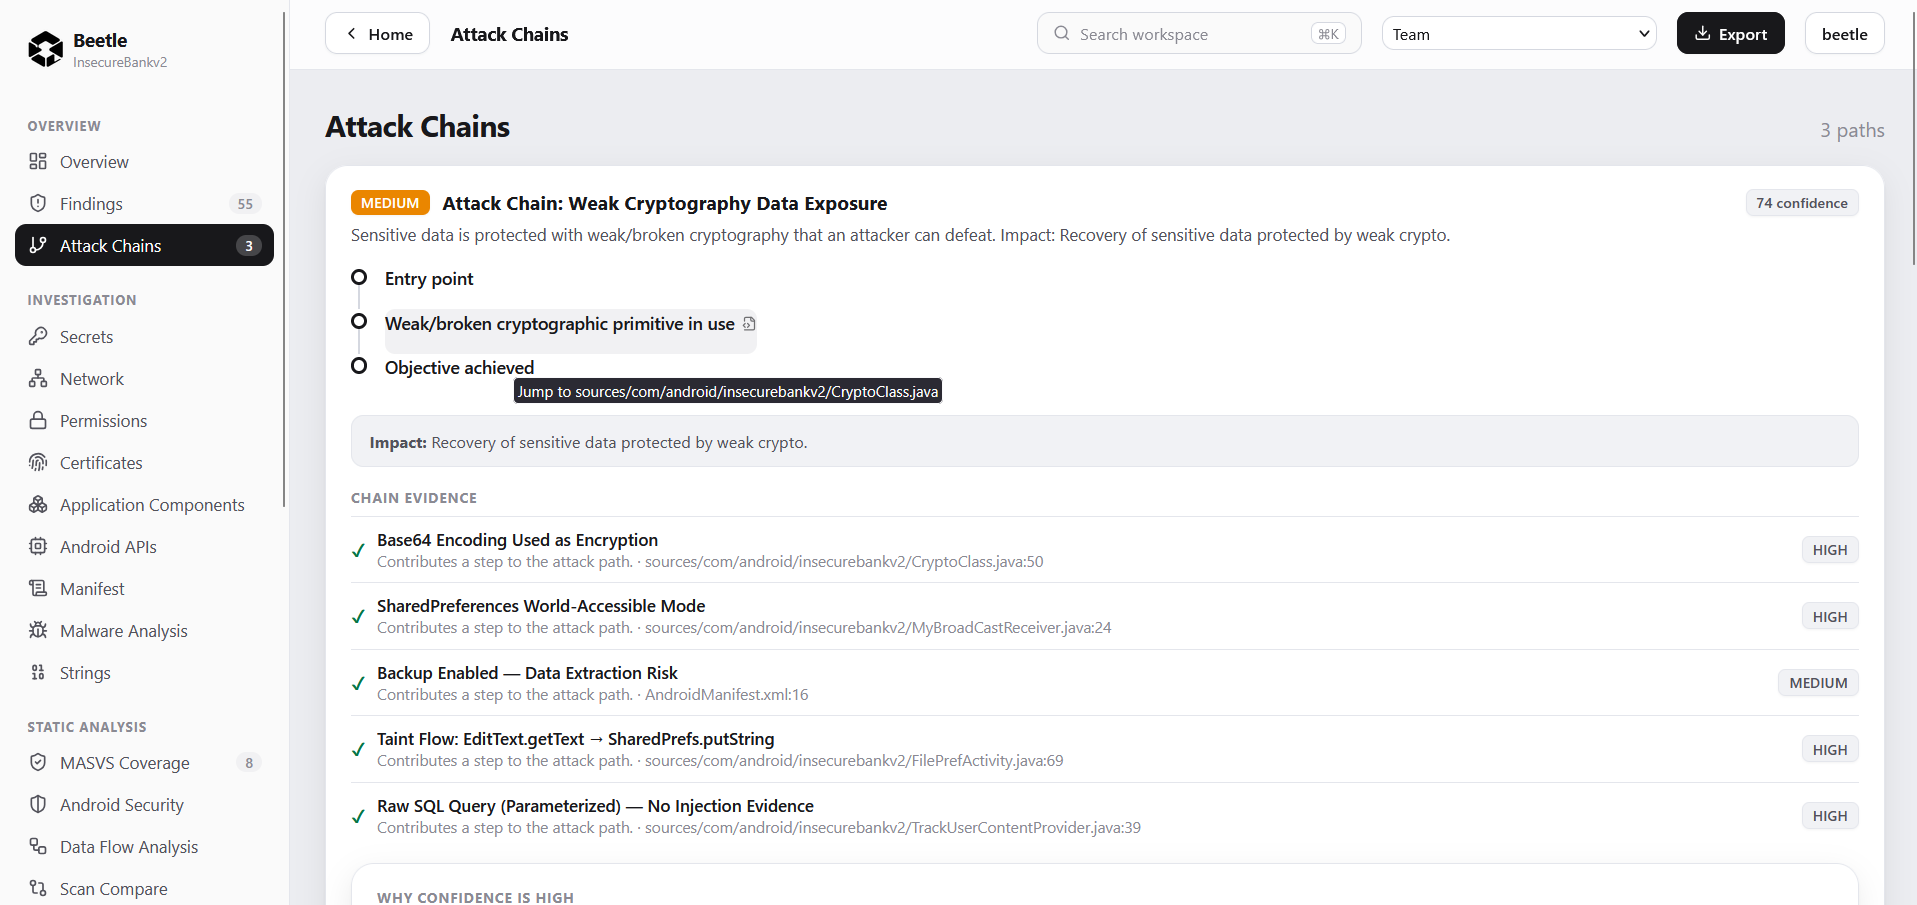
Attack Chains answers what the flat list can’t: do separate weaknesses combine into something worse? It draws correlated findings as a path — entry point, the steps between, an objective — with the evidence for each step and a confidence for the chain as a whole. It’s where you reason about aggregate risk rather than individual issues.
Investigation — the attack surface
These panels are the raw inventory Beetle builds before it judges anything. Open them for ground truth about one dimension of the app rather than a verdict.
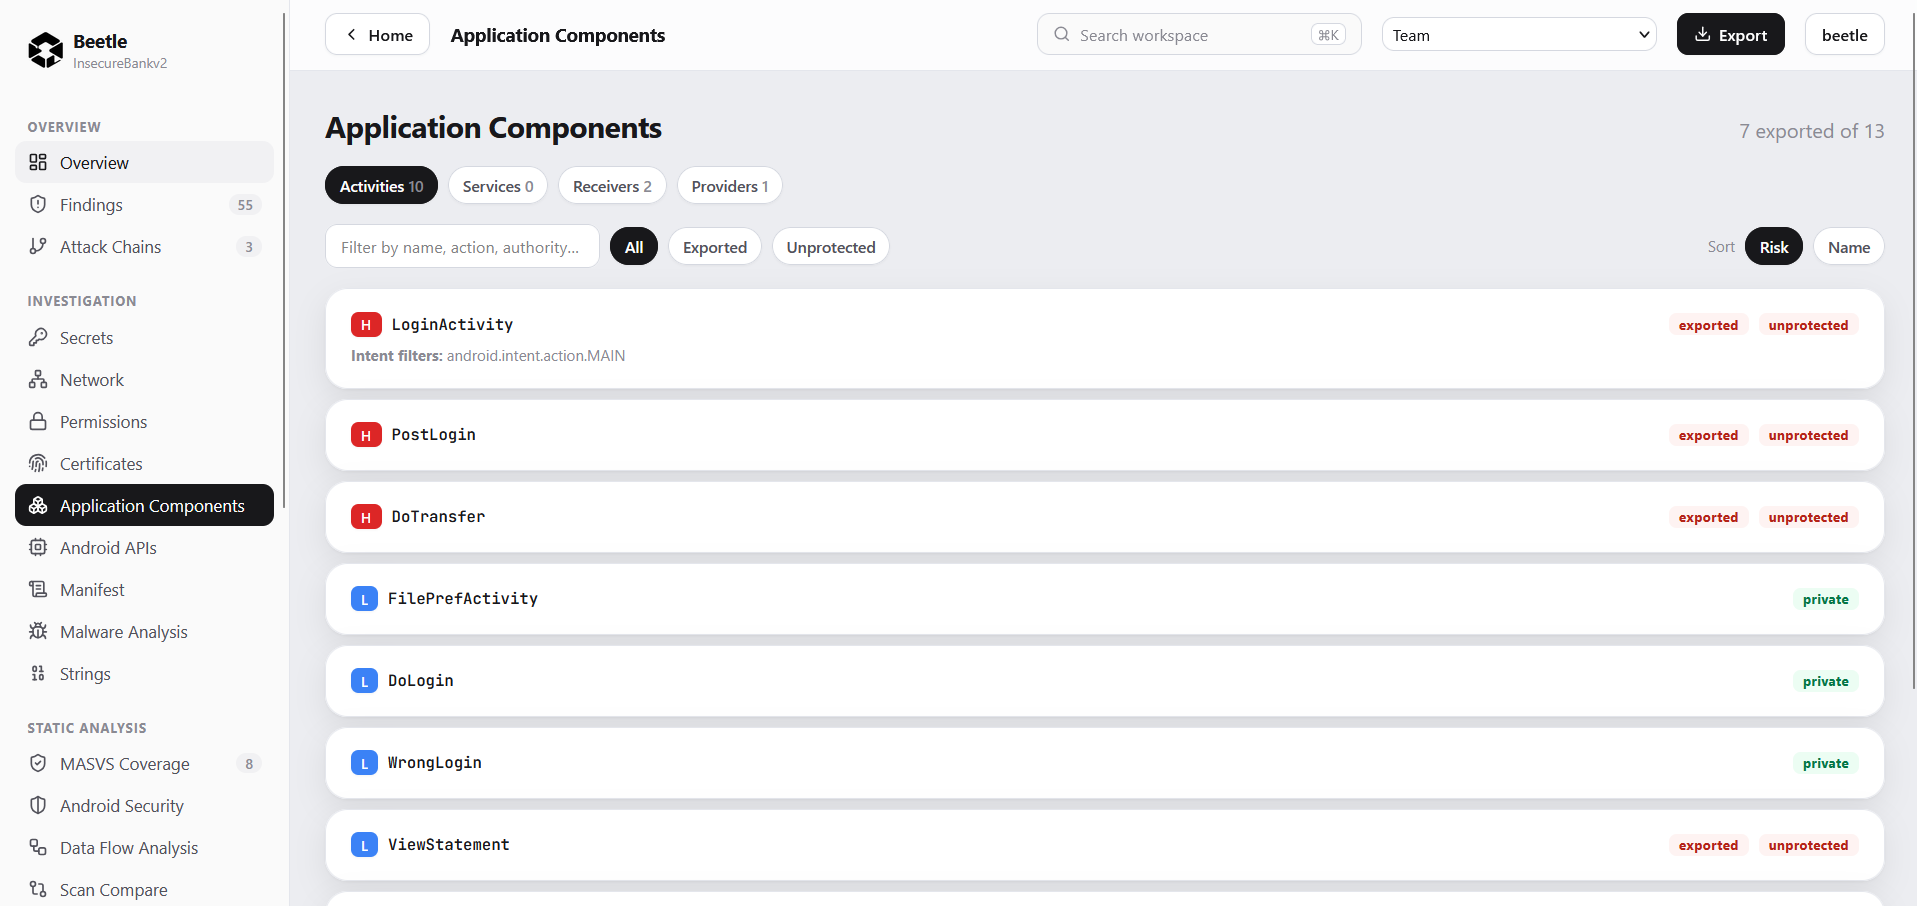
- Application Components — the activities, services, receivers, and providers the app declares, each marked exported or private and protected or not: the map of what other apps can reach.
- Permissions — everything the app requests, including custom and signature-level permissions (the latter granted only to apps signed with the same key as the declarer).
- Network — how the app handles network traffic: cleartext policy, pinning, trust anchors, debug overrides.
- Certificates — the signing certificates and any certificates bundled inside the app.
- Secrets — candidate credentials and keys recovered from the build, classified so public identifiers don’t read as leaks.
- Android APIs — the sensitive framework calls the app makes, grouped by capability.
- Manifest — the decoded
AndroidManifest.xmlbehind the components and flags above. - Strings — extracted strings: endpoints, tokens, and debug artifacts spotted by eye.
- Malware Analysis — reputation and behavioural signals, including the optional VirusTotal lookup.
Static analysis
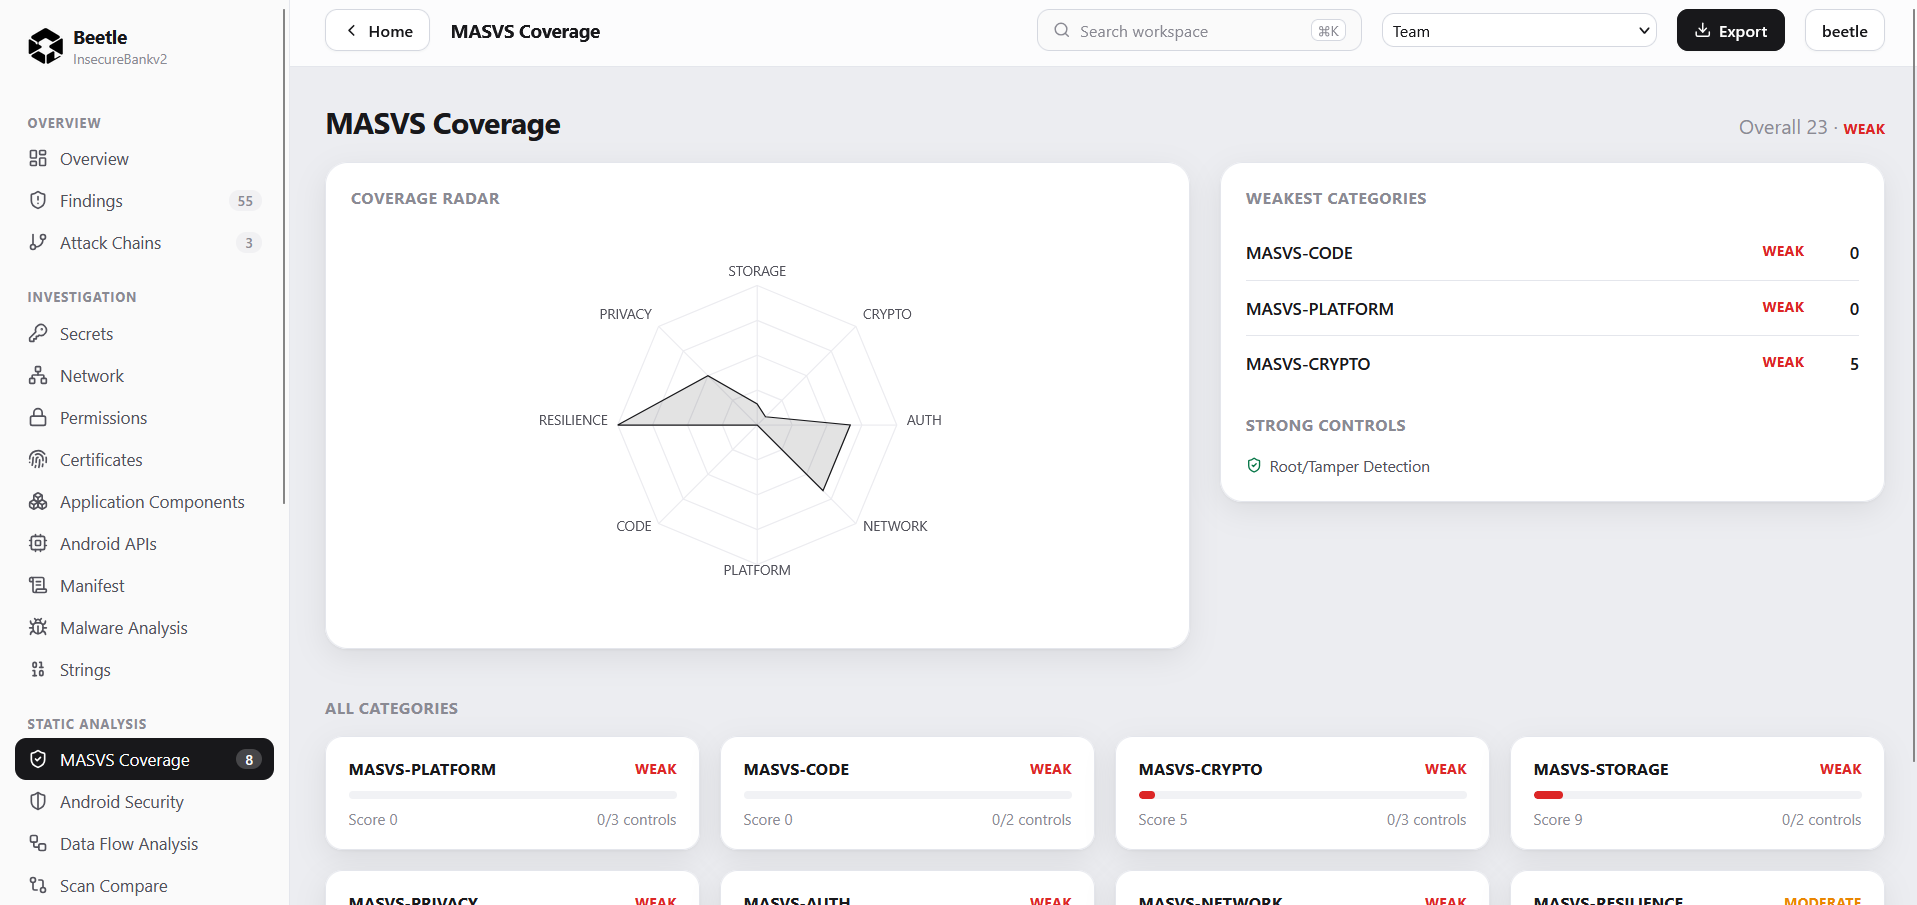
- MASVS Coverage — the scan’s findings mapped onto the OWASP MASVS control categories, with a coverage radar and the weakest categories called out. Open it to talk about standards coverage rather than individual bugs.
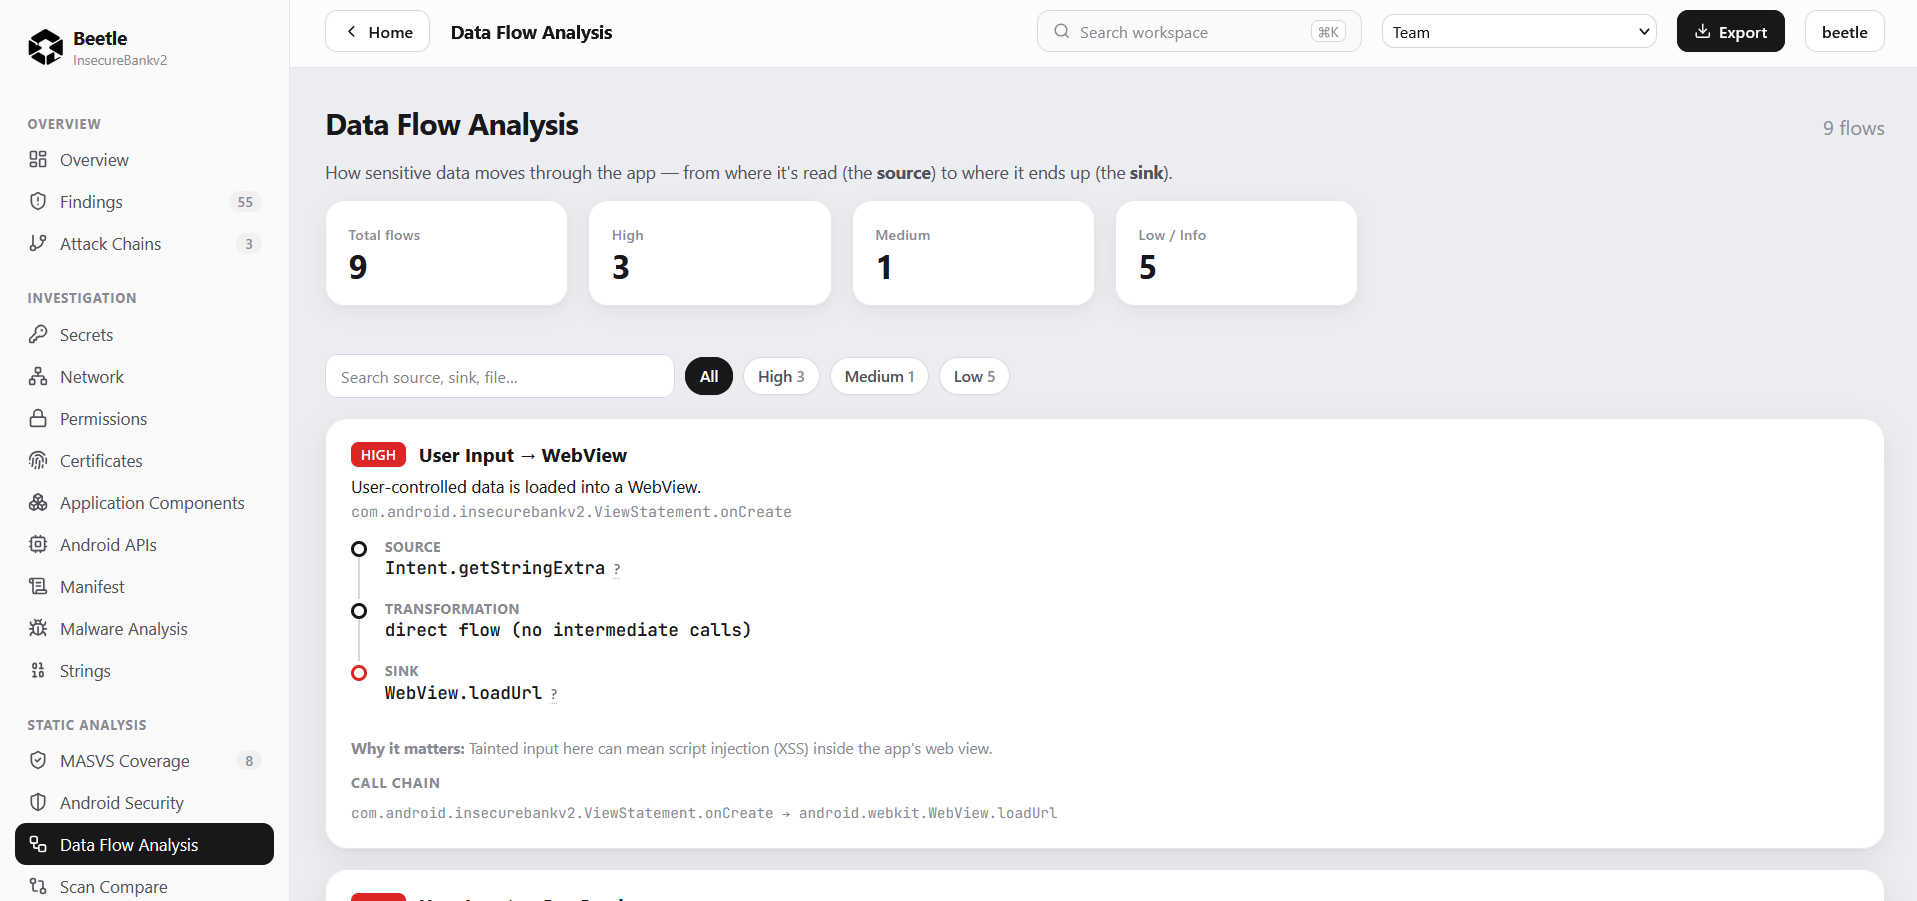
- Data Flow Analysis — the taint results: each tracked flow from a source to a sink, the call path between them, and a note on why it matters. Open it when you need to know whether input can actually reach a dangerous API, not just that the API is present.
- Android Security — Android-specific hardening and platform checks in one place.
- Scan Compare — a diff between two scans of the same app: new findings, fixed ones, regressions. What you want across releases and in CI.
Source
- Source Explorer — the full decompiled and resolved source tree, browsable directly. Every finding’s view code action lands here at the exact line, which is what makes the evidence checkable.
- Project Files — the raw file listing of the unpacked build, for when you want an artifact the decompiled tree doesn’t surface.
Reports
- CISO Summary — a high-level, non-technical read of a scan for a stakeholder who wants posture, not line numbers.
- Developer Report — the same scan aimed at whoever has to fix it: the findings, their evidence, and remediation.
- Reports & Export — the export hub, covered under Output and CI below.
AI
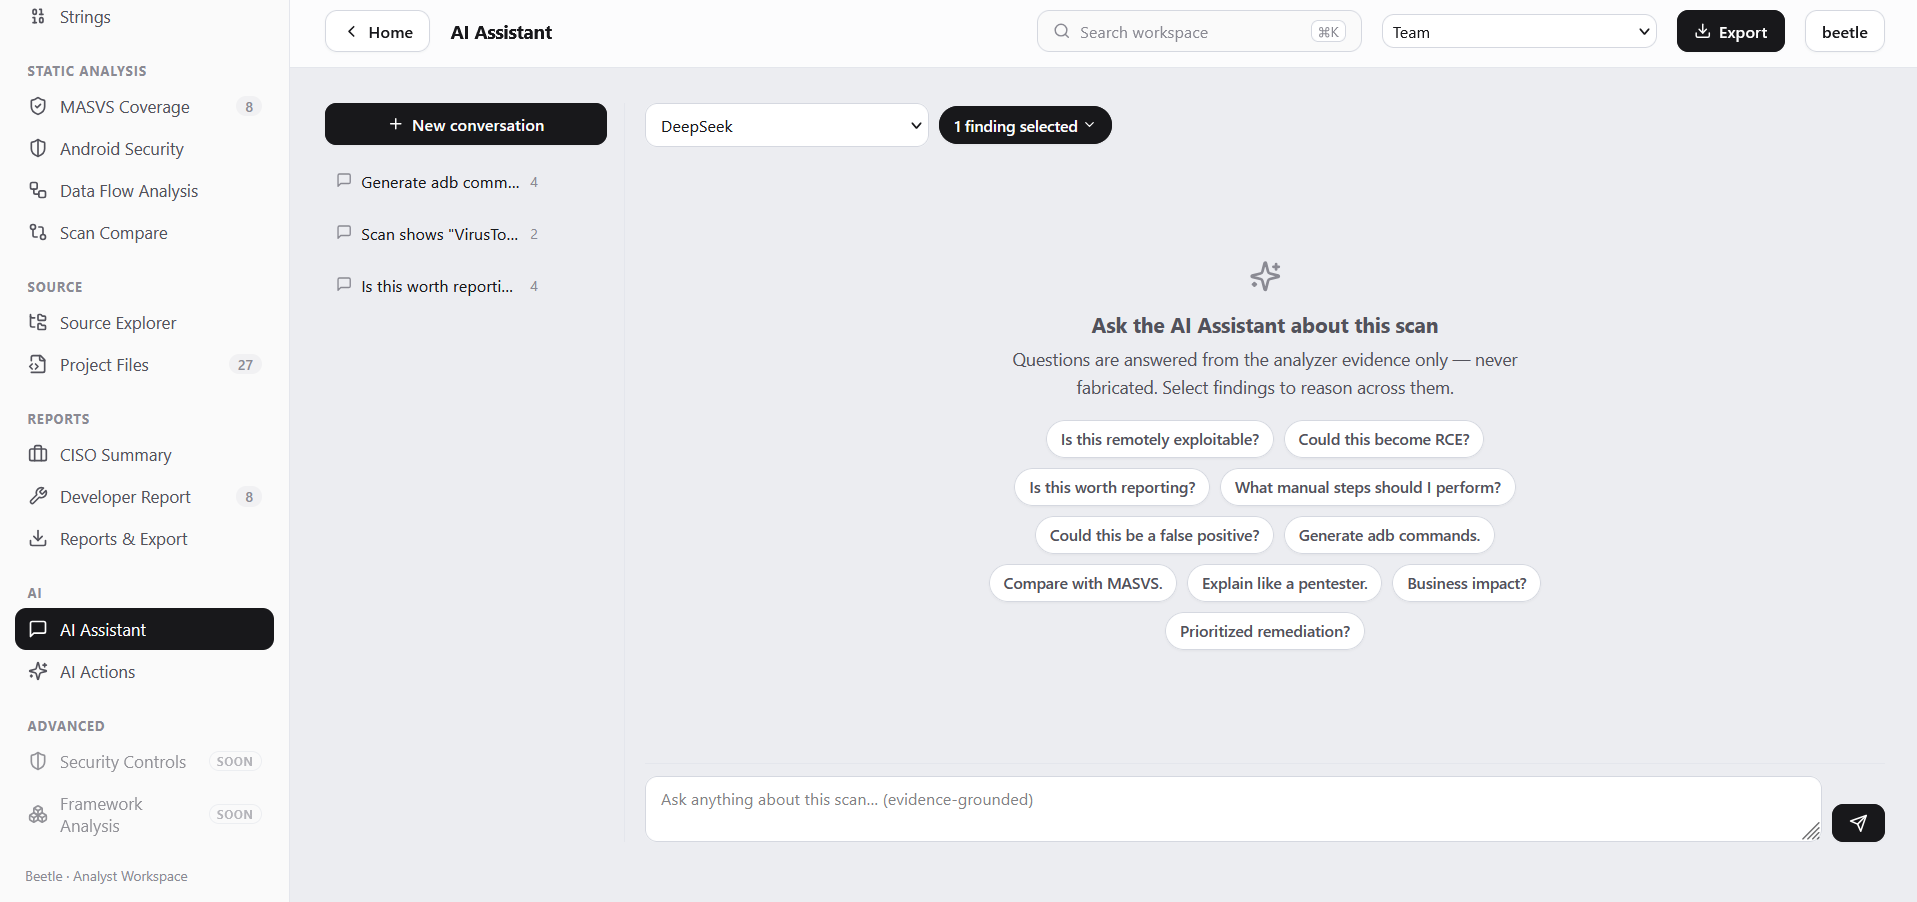
- AI Assistant — optional conversational Q&A over a scan, covered under The AI layer below.
Multi-user and collaboration
A finished scan isn’t a report one person reads and closes — it’s a worklist several people grind through, and every finding needs a decision that sticks. Beetle holds those decisions itself, so a team isn’t tracking triage state in a side spreadsheet that drifts out of sync with the scan.
Accounts and roles. Beetle is multi-user; an admin creates accounts from the Users screen (there’s no self-signup). Each account carries one of four roles, each inheriting the rights of the one below it:
- admin — full control, including user management;
- manager — plus control over sharing, suppressions, and assignments across the workspace;
- analyst — triage findings: change state, assign, comment, and suppress rules;
- readonly — view only, no changes.
For automation, Beetle can also issue a long-lived API key scoped to a role, so a CI pipeline authenticates without a password.
One shared workspace. Everyone signs into the same workspace — there’s no multi-team tenancy. The control in the top bar, next to Export, sets a scan’s visibility, not which team you’re in: Team (visible to everyone signed in), Shared (any signed-in user with the link), or Private (just the owner and managers). Only an admin or manager can change it; everyone else sees the current setting as a read-only badge.
Per-finding triage. Open a finding and its drawer carries a collaboration block. A finding moves through six states — Open, Confirmed, Need Review, Mitigated, Accepted Risk, and False Positive — and you can put a priority on it (P1–P4) and assign it to someone by typing their username. Beside that is a comment thread that takes a small slice of markdown — **bold**, *italic*, `code`, and links — for the context the next reviewer needs.
The detail that makes this more than a task tracker: triage is keyed to the app and the finding, not to a single scan run. Rescan the next build and every state, assignment, comment, and suppression carries forward automatically — you confirm or accept a finding once, and it stays decided across releases.
Suppressing a rule. When a rule is noise for a given app — a real finding elsewhere, a known non-issue here — an analyst can suppress it from the finding drawer with a required reason. The suppression is stored against the app, so it holds for this scan and every later one: matching findings are moved aside (still inspectable, tagged with the reason) and dropped from the score and the exports, rather than silently deleted.
How the engines work
Unpacking and decompilation
Android: an APK is a ZIP, but the parts that matter aren’t plain text — the manifest is binary-encoded, resources live in a compiled table, and the code is DEX bytecode. Beetle decodes and decompiles all of it into a readable source tree it can link findings to.
iOS: an IPA is a ZIP with the app bundle inside it at Payload/Name.app. Binary property lists are converted first; the Mach-O executable, sometimes a multi-architecture archive, is parsed for its structure, entitlements, and hardening flags.
Attack surface mapping
Before any detection runs, Beetle inventories the app — components, permissions, network configuration, endpoints, libraries, and framework. Framework detection matters more than it looks: when an app’s logic is compiled into a native library instead of bytecode, as with some cross-platform frameworks, analysis that stops at the bytecode sees almost nothing. Beetle identifies the framework and adjusts where it looks, so the pipeline analyses the app rather than its loader.
Detection engines
Detection is several engines, not one pass. Rule-based scanning covers known-bad patterns; a secret engine extracts and validates candidate credentials, classifying each so a public identifier scores INFO rather than flagged as a leak; endpoint and network engines recover hosts and transport settings. Every engine emits a candidate, not a verdict — one that still has to survive ownership, confidence, and evidence checks before it becomes a finding.
The taint engine
Pattern matching can tell you a dangerous API is present; the taint engine asks whether anything reaches it. Working over the call graph, it marks sources — where attacker-influenced data enters — and sinks — where that data becomes dangerous — then searches outward from each source for a path to a sink. The search is bounded to six hops, where one hop is one method call in the chain — onCreate → buildUrl → normalize → loadUrl is three hops. A bound is necessary because a call graph is densely connected: search deep enough and almost anything connects to anything, so an unbounded search returns noise rather than flows. Six is a pragmatic choice rather than a measured one — it keeps reported paths at a depth an attacker could realistically drive end to end, and keeps analysis tractable alongside the engine’s other guards (a path cap, a wall-clock timeout, and a bytecode-size limit). The tradeoff is real: a genuine flow deeper than six hops won’t be reported.
The categories it treats as sources and sinks:
| Sources — data enters | Sinks — data becomes dangerous |
|---|---|
Intent.getStringExtra, Bundle.getString | SQLiteDatabase.rawQuery |
EditText.getText | Runtime.exec |
| Location and device data | WebView.loadUrl |
| SMS and account data | SmsManager.sendTextMessage |
| Deep-link parameters | Log.d and other log / file writes |
A reported flow has this shape (illustrative, not from a specific scan):
taint flow — illustrative[SOURCE] a value read from an incoming intent
│
├─ passed through one or more methods (≤ 6 hops)
│
[SINK] └─ reaches a WebView URL load
why it matters: attacker-influenced input reaching this sink can mean
script injection inside the app's web viewOne caveat, though, about what this really proves:
The search proves a chain of calls connects a source to a sink within the hop limit — not that the tainted value survives the trip. It doesn’t track the value through every assignment, so a reported flow is a strong lead, not a guarantee that tainted data arrives unaltered.
A guard trims the obvious false positives: it discards a flow when the sink only ever receives compile-time constants — values fixed in the code rather than derived from input, like a check that runs a hard-coded command string. Reachable-but-constant isn’t a vulnerability, so it’s removed rather than quietly downgraded.
Chain reconstruction
Chains are assembled from a set of detectors, each describing a combination worth flagging — a web-facing entry point together with a code-execution sink, say — that fires when those capabilities are present in the same build. A chain’s severity is the highest among its steps; its confidence is computed, not assigned:
chain confidenceconfidence_score = mean_member_confidence * (0.5 + 0.5 * evidence_ratio)The mean confidence of the member findings is discounted by how much of the chain is backed by concrete evidence, so a chain resting mostly on inference scores lower than one where every step is evidenced.
Ownership, confidence, evidence, fusion
Four engines shape every finding after detection — they’re the fields the finding drawer shows — and each one adds metadata; none silently deletes a finding:
- Ownership separates first-party code from bundled libraries, so a weakness the developer can’t patch is reported as a dependency issue, not their bug. A large share of raw detections live in third-party code, and keeping them off the first-party list is much of what makes it workable.
- Confidence scores how strongly the evidence supports the verdict, so a reviewer knows what to check first.
- Evidence attaches the concrete artifact behind each finding and drives the evidence count in the drawer.
- Fusion merges detections that are really one issue seen from several angles, so counts reflect problems, not sightings.
Scoring
The security score runs 0–100 as 100 − deductions + bonuses. Severity weights are fixed — critical 15, high 8, medium 3, low 1, info 0 — but deductions taper rather than staying flat: the i-th finding of a given severity deducts weight / i. Three HIGH findings, for example, deduct 8, then 4, then 2.67 — 14.67 in total, not 24 — so a pile of low-severity findings can’t outweigh a single critical while volume still registers. A separate cap ties the letter grade to the most severe issue present — a top grade requires nothing above informational — and attack chains add a correlated-risk penalty, an extra deduction for findings that combine into a chain. Every deduction is tracked per finding, so the score is itemised: you can see which findings cost what.
Android specifics
- DEX and native code — call-graph analysis over the DEX bytecode, plus native
.solibraries fingerprinted and matched against known CVEs. - Signing — the signing certificate and the implications of the signature scheme in use.
- Framework awareness — native-compiled and JavaScript-bundle frameworks detected so analysis doesn’t stop at the loader.
iOS specifics
- Binary hardening — PIE (randomised load address), stack canaries (buffer-overflow guards), ARC (compiler-managed memory), and encryption status, read from the Mach-O.
- Entitlements — keychain and app groups, associated domains, and debug entitlements that reached a release build.
- Transport security — App Transport Security configuration, arbitrary-load exceptions, and per-domain relaxations.
- URL schemes and universal links — custom schemes and link handlers as an entry surface.
The AI layer
The AI features are optional and strictly interpretive. With a provider configured — Claude, OpenAI, Gemini, DeepSeek, or a local Ollama — the AI Assistant answers questions about a scan, and AI Actions attach explanation and remediation help to individual findings. The constraint is architectural: the AI reads the analyzer’s evidence and reasons over findings you select; it doesn’t scan, and it doesn’t discover or invent findings. Turn the provider off and every finding, score, and chain above is exactly the same — the analysis engine is the product, and the AI is a reading aid on top of it.
Output and CI
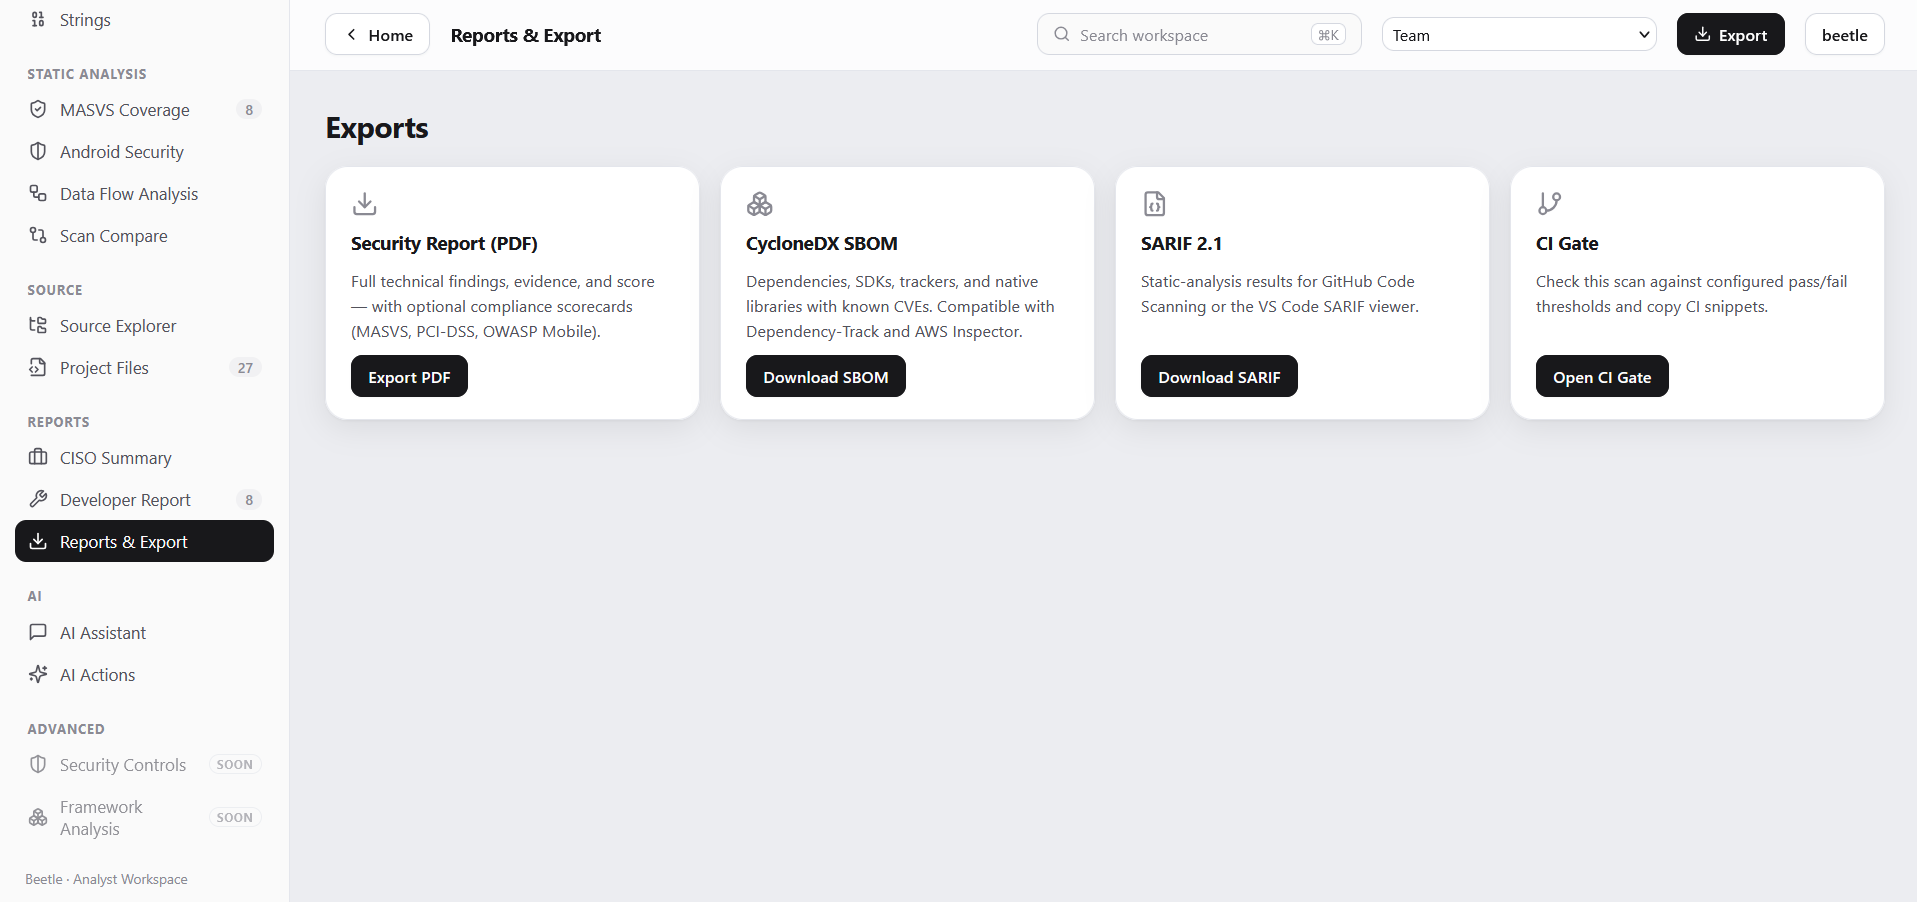
A scan is only useful if its result travels. From Reports & Export, Beetle produces four outputs:
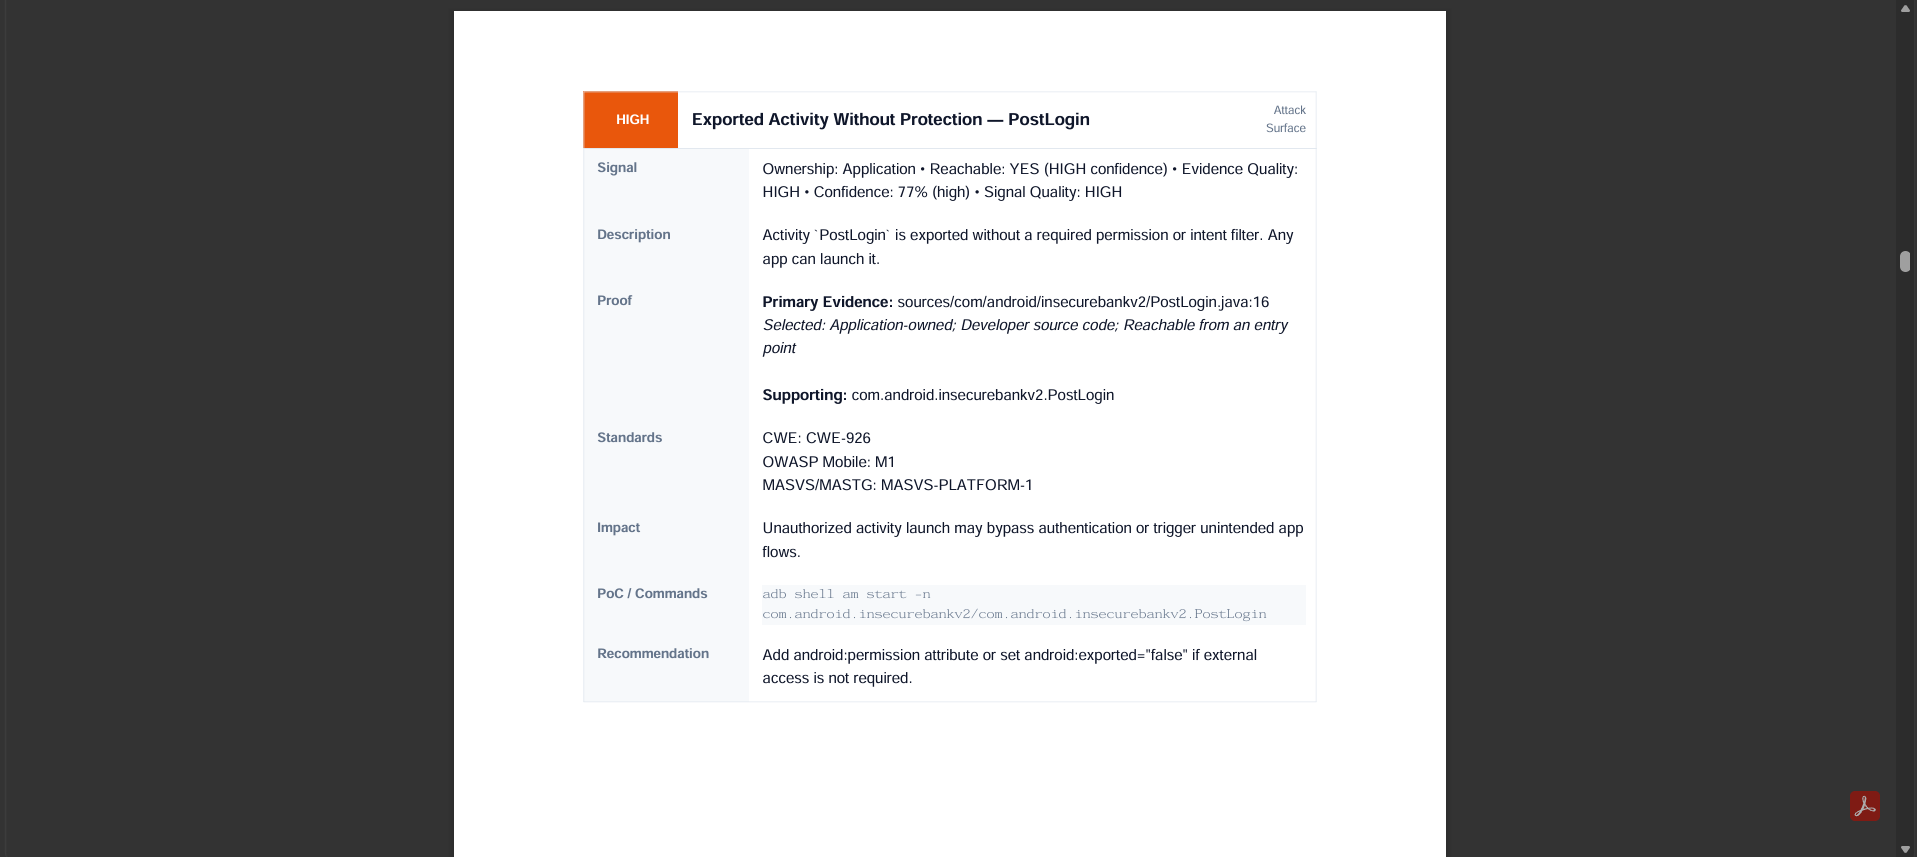
- a technical PDF — the full findings with evidence and score, plus optional compliance scorecards;
- a CycloneDX SBOM — the dependency and native-library inventory, for software-composition tooling;
- a SARIF file — static-analysis results in the standard format code-scanning platforms and editors consume;
- a CI gate — a pass/fail check against thresholds you configure, with copyable snippets to wire into a pipeline.
The PDF is the client-ready artifact: each finding is laid out end to end — evidence, standards mapping, impact, a reproduction command, and a remediation — so the document stands on its own without the UI. Webhooks round out the path, letting a completed scan notify other systems so Beetle sits inside a build pipeline rather than beside it.
Roadmap
Two panels already sit in the sidebar marked coming soon — Security Controls and Framework Analysis. Beyond those, the tracked directions are infrastructure-as-code analysis, dynamic (runtime) analysis alongside the static engines, cloud-configuration analysis, a team-oriented enterprise dashboard, and a plugin SDK for custom detection engines.
Contributions are genuinely welcome — issues, pull requests, new detection rules, and false-positive reports. A false positive you report is worth as much as a feature, because it makes the next scan more trustworthy. Everything happens on the GitHub repo.
Run it yourself
Beetle is open source under Apache 2.0. Clone it, point it at a build you’re authorised to test, and read the evidence behind whatever it reports. If Beetle ever reports something you can’t trace back to concrete evidence, that’s a bug worth reporting.